About 60% of new managers underperform for their first two years in the role, according to CEB (now Gartner) research on the manager transition — and Gallup finds organizations fail to select the right manager 82% of the time. Those two numbers frame the most under-funded risk in most people strategies: the population that controls the daily work experience of the majority of the workforce is promoted for prior output and left to improvise the job. This roundup assembles the twelve statistics HR and L&D leaders reach for most when building the new-manager development case, each with its source and — more usefully — the action it justifies. Quote them precisely; vague versions of these numbers circulate and get corrected in rooms you will not be in.
The failure statistics
1. 60% of new managers underperform for their first two years. CEB (now Gartner) research on the manager transition. The transition is a career re-launch — identity change, delegation, feedback, performance conversations — and most organizations treat it as a title change with a cake. Action: train the transition deliberately; the 30-60-90 curriculum exists for exactly this window.
2. Around 40% of new leaders fail within 18 months. Center for Creative Leadership estimates across transition studies. "Fail" in these studies means pushed out, plateaued or performing below expectations — not voluntary quits. Action: the first half-year needs structured support, not osmosis; treat manager onboarding with the same seriousness you give customer-critical hires.
3. Organizations fail to choose the right manager 82% of the time. Gallup's analysis of managerial selection, which found companies miss on talent for the role most of the time — usually by promoting the best individual contributor. Action: weight selection criteria toward people capability, not just output, and use structured leadership assessment evidence before the promotion letter goes out.
The engagement and retention statistics
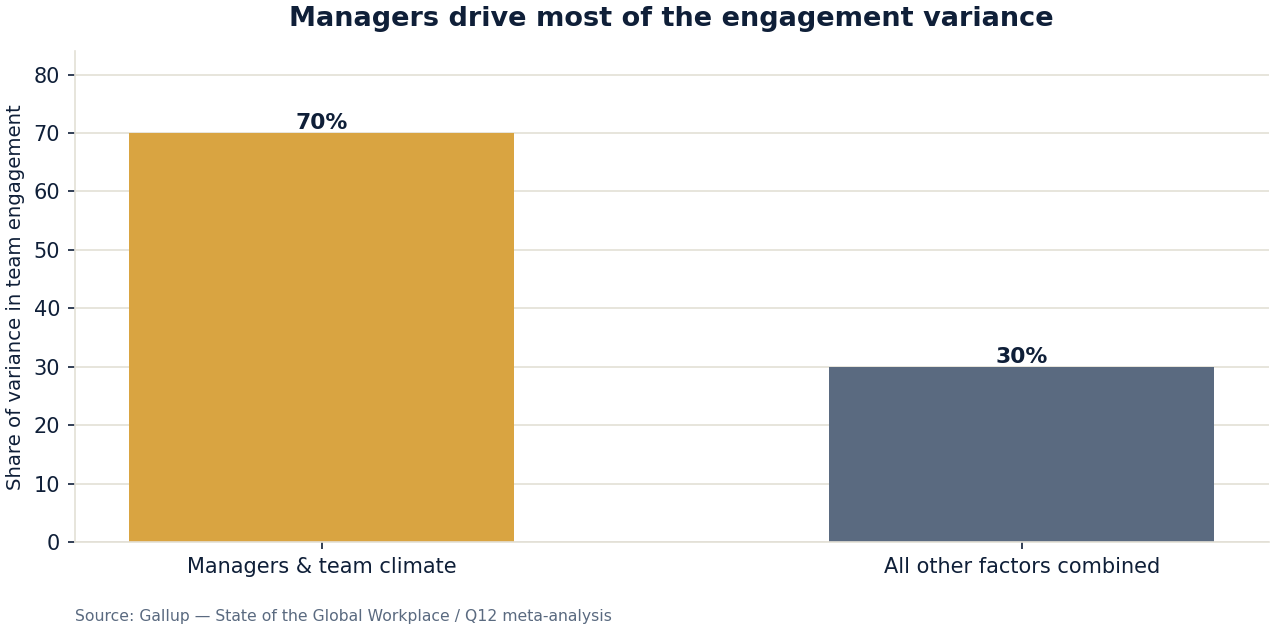
4. Managers account for ~70% of the variance in team engagement. Gallup, State of the American Manager — the single most quotable number in this file. Any engagement strategy that skips manager capability is decorating around the cause.
5. Low engagement drains ~$8.8 trillion from the global economy. Gallup, State of the Global Workplace — roughly 9% of global GDP. Action: the ROI denominator for manager training is engagement-linked attrition and productivity, not "training satisfaction".
6. Employees who receive meaningful weekly feedback are materially more engaged. Gallup's feedback research shows weekly-feedback populations landing in markedly higher engagement bands than annual-review-only ones. Action: feedback skills belong in the first training block of any manager curriculum, not the fourth.
7. Replacing an employee costs one-half to two times annual salary. Gallup's compensation-based estimates; SHRM's hiring-cost research adds recruiting, onboarding and productivity drag on top. Action: a manager development program that saves one regretted exit per cohort usually funds itself — and manager-driven attrition is the line item to watch.
The training-gap statistics
8. The majority of new managers receive no formal training. Repeatedly found across workforce studies; DDI and Gallup analyses consistently place formal management-training coverage low. Action: the assumption that "they'll pick it up" is the most expensive line in your people budget.
9. Only ~12% of organizations report strong leadership bench strength. DDI, Global Leadership Forecast. Action: first-time-manager development IS bench-building; the succession pipeline guide shows how the cohorts feed it.
10. Leaders learn ~70% from experience, 20% from people, 10% from formal input. Center for Creative Leadership's 70-20-10 model. Action: a curriculum of workshops alone under-trains; pair every module with a stretch assignment — the program blueprint shows the mix.
The cost and benchmark statistics
11. Average direct learning spend: ~$1,280 per employee per year. ATD, State of the Industry. Action: a first-time-manager program with per-participant cost under this benchmark is easy arithmetic for the CFO.
12. Ready-to-deliver leadership kits start around $89.50 one-time — a multi-module program with unlimited internal delivery (current market pricing, e.g. First-Time Manager Essentials). Action: the "too expensive to train everyone" argument collapses at licensing prices; the binding constraint is scheduling, not budget. The retention math helps too: LinkedIn's Workplace Learning Report finds ~94% of employees would stay longer at a company that invests in their learning.
Reading the numbers together: the compounding model
The twelve at a glance:
| # | Statistic | Source | The action it justifies |
|---|---|---|---|
| 1 | 60% of new managers underperform for 2 years | CEB/Gartner | Train the transition, don't announce it |
| 2 | ~40% of new leaders fail within 18 months | CCL | Structured first-half-year support |
| 3 | 82% of manager selections misfire | Gallup | Weight selection toward people capability |
| 4 | Managers drive ~70% of engagement variance | Gallup | Manager capability is the engagement strategy |
| 5 | Disengagement costs ~$8.8T globally | Gallup | Price the exposure, not attendance |
| 6 | Weekly feedback lifts engagement | Gallup | Teach feedback in block one |
| 7 | Replacement costs 0.5-2x annual salary | Gallup/SHRM | One saved exit can fund the program |
| 8 | Most new managers get no formal training | DDI/Gallup | Fund the gap deliberately |
| 9 | Only ~12% report strong bench strength | DDI | Manager cohorts feed the pipeline |
| 10 | 70-20-10 learning mix | CCL | Pair modules with assignments |
| 11 | ~$1,280 average annual learning spend | ATD | Benchmark the per-participant cost |
| 12 | Kits from ~$89.50 one-time | Market | Remove the budget excuse |
Individually, each statistic argues for one intervention. Read as a system, they argue for sequencing. The failure statistics (1-3) identify the population: managers in their first two years, chosen mostly by prior output. The engagement statistics (4-7) price the exposure: manager-driven engagement variance flows directly into the attrition and replacement costs the business already pays. The gap statistics (8-10) explain why nothing improves by default: no training, no bench, and a learning mix that over-weights workshops. The benchmark statistics (11-12) remove the budget excuse.
The compounding effect works both ways. Untrained first-time managers become mid-level leaders who model the habits they improvised — Gallup's selection and variance numbers then compound upward through every team they touch. Trained ones compound capability downward: every cohort teaches its next cohort through the norms it installs. This is why the highest-leverage single intervention in most organizations is not senior-leader coaching (visible, prestigious, narrow) but systematic first-line-manager development (unfashionable, cheap at licensing prices, wide).
Turning the numbers into the one-page case
The sequence that works with executives: failure statistics (the burning platform, items 1-3) → engagement economics (the cost of inaction, items 4-7) → the training gap (why nothing happens by default, item 8) → your costed intervention with a measurement plan (items 9-12). One page, one decision requested, one metric promised back. The funding-conversation mechanics — proposal blocks, pilot design, the 90-day readout — are in our executive buy-in guide.
Three caveats protect your credibility when you present:
- Dates drift — cite the source and era ("Gallup's State of the American Manager"), never "a study says".
- Averages hide variance — your population, industry and baseline move the local numbers; present benchmarks as context, not prophecy.
- Correlation language matters — "research links manager capability to engagement" survives scrutiny; "training caused a 40% improvement" invites an audit.
Use each statistic attached to its action. A number without a decision attached is trivia; a number with a decision is a business case.
Frequently asked questions
What percentage of new managers fail?
The two most-cited figures: CEB/Gartner found about 60% of new managers underperform for two years, and Center for Creative Leadership transition research estimates around 40% of new leaders fail within 18 months. Definitions vary across studies — quote the source with the number.
How much of team engagement is driven by the manager?
Gallup attributes roughly 70% of the variance in team engagement to the manager. It is the single largest controllable factor in your engagement system, which is why manager training outperforms most engagement platforms per dollar.
What does it cost to replace an employee?
Gallup estimates one-half to two times the employee's annual salary depending on role and seniority, counting recruiting, onboarding and lost productivity; SHRM's research adds further hiring-cost components. That range is why manager-driven attrition is the line item to watch.
Do most new managers get training?
No — across major workforce studies, the majority of first-time managers report receiving no formal management training before or at appointment. Structured programs like the 30-60-90 curriculum directly address the gap.
What is the ROI of first-time manager training?
Modeled honestly: one avoided regretted exit — worth 0.5-2x salary by Gallup's estimate — typically exceeds the program cost many times over at licensing prices, before counting engagement-linked productivity. Insist on the measurement plan before promising percentages.
Where do I start if I can only fund one intervention?
A licensed first-time-manager track — First-Time Manager Essentials, $89.50 for unlimited cohorts — covering the transition window where the failure statistics concentrate. It is the highest-density investment in the leadership pipeline.
Your next step
Build the case with the numbers above, then close the gap. The First-Time Manager Essentials program covers the transition window end to end — role shift, delegation, feedback, performance conversations — for $89.50 with unlimited internal delivery. Pair it with our leadership development plan template, or browse the full PersonaPulse library to build out the rest of the curriculum.